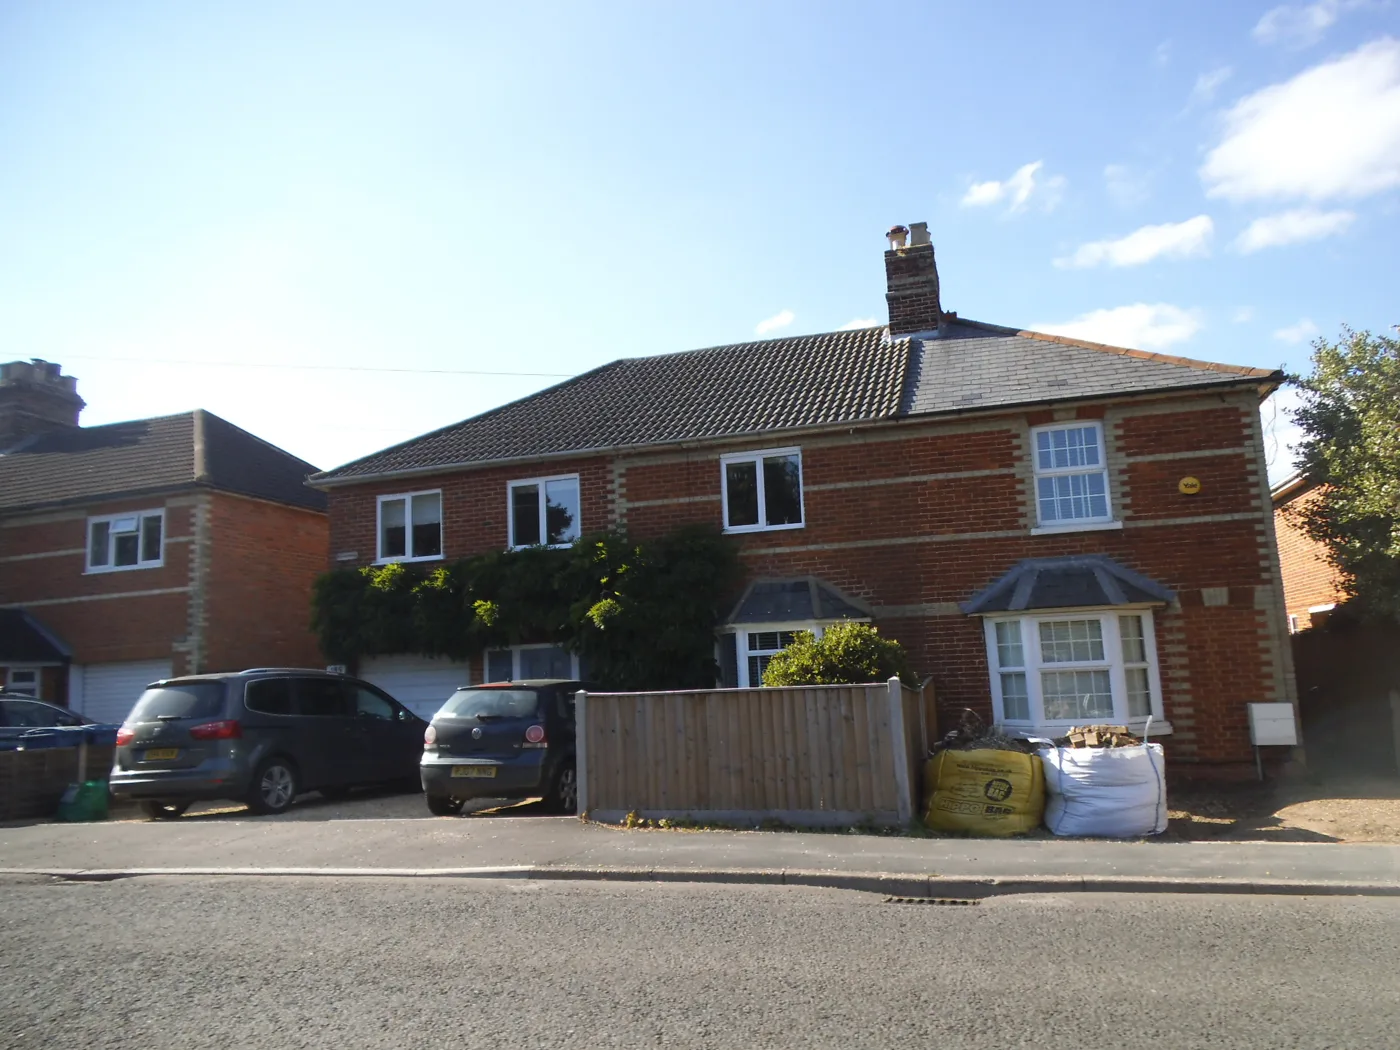

Hart's average rose to £481,051 in July and its annual rate ticked up to 2.6%, the first rise in six months. A semi now costs the same as the average Hart home.
The average home in Hart sold for £481,051 in July 2026, and for the first time this year the district’s annual growth rate went up rather than down. It reached 2.6%, against 2.4% in June.
That ends a run of six straight monthly falls in the growth rate, from 4.6% in January. The figures come from the UK House Price Index, released by HM Land Registry and the Office for National Statistics on 16 September. They are built from completed sales, not asking prices, and they cover the whole of Hart district: Fleet and Church Crookham, Hook, Odiham and North Warnborough, Hartley Wintney, Yateley, Blackwater, Eversley and the villages between them.
One caution before the numbers. The UKHPI average is a mean, not a median. A handful of large sales pull it up, which is why a district the size of Hart can move several thousand pounds in a month on fewer than a hundred recorded sales.
The headline figures
| Measure | July 2026 |
|---|---|
| Average price, all property types | £481,051 |
| Change over 12 months | +2.6%, or £12,167 |
| Change over the month | +0.1%, or £574 |
| First-time buyer average | £358,898, up 2.5% |
| Former owner-occupier average | £581,194, up 2.7% |
| Rank among 295 English districts | 38th dearest |
Hart moved up three places on that last line. It was 41st in June, on the same release.
The growth rate stopped falling
Hart’s annual change had narrowed in every month of 2026 until now. July broke the pattern, by a small margin but in the other direction.
For scale: 85 of the 295 English districts recorded an outright annual fall in July and Hart did not, and 126 fell on the month while Hart edged up. Hart’s rate of growth, though, is unremarkable. Rank it by annual change rather than price and the district comes 115th of 295.
A semi in Hart now costs the same as the average Hart home
This is the number worth carrying around. A semi-detached house in Hart averaged £481,069 in July. The district’s average for a home of any type at all was £481,051. The two are £18 apart.
| Property type | Hart | Change over 12 months | England |
|---|---|---|---|
| Detached | £791,813 | +2.4% | £474,626 |
| Semi-detached | £481,069 | +4.1% | £292,024 |
| Terraced | £384,668 | +3.2% | £247,081 |
| Flat or maisonette | £239,550 | +0.2% | £217,362 |
Two things follow from that table.
The first is that a semi-detached house in Hart costs £6,443 more than the average detached house in England. Fleet’s three-bedroom semis are not competing with their equivalents nationally; they are competing with detached houses almost everywhere else.
The second is that flats have stopped moving. Hart flats rose 0.2% over the year, which is £429. Semis rose 4.1%. The gap between the cheapest and dearest kind of home in the district is widening rather than closing, which matters most to anyone trying to move from a flat to a house locally. It is worth saying that flats here are still doing better than the national picture: England flats fell 3.5% over the same year.
Still Hampshire’s dearest, and the gap over Winchester has reopened
Hart remains the most expensive of the eleven Hampshire districts. In August we reported that its lead over Winchester had shrunk to £8,842 on the June figures then published. On July’s data the lead is £18,026, because Winchester fell 1.0% on the month while Hart rose.
| District | Average price | Change over 12 months |
|---|---|---|
| Hart | £481,051 | +2.6% |
| Winchester | £463,025 | +2.1% |
| East Hampshire | £440,541 | −1.2% |
| New Forest | £384,977 | 0.0% |
| Basingstoke and Deane | £370,223 | +1.0% |
| Test Valley | £368,131 | −0.6% |
| Fareham | £333,599 | +1.4% |
| Rushmoor | £326,771 | +0.5% |
| Havant | £315,820 | −1.2% |
| Eastleigh | £310,283 | +2.6% |
| Gosport | £240,696 | +3.4% |
Hampshire as a county averaged £364,336 in July, up 0.9%. The South East averaged £380,878, up 0.2%. England averaged £293,479, up 1.1%. Hart is £116,715 above the county and £187,572 above England.
The districts on Hart’s own borders are a mixed picture:
- Rushmoor (Farnborough and Aldershot), against Fleet’s southern edge: £326,771, up 0.5%. That is £154,280 less than Hart.
- Basingstoke and Deane, the other side of Hook: £370,223, up 1.0%.
- Surrey Heath, which Blackwater and Yateley run into: £457,988, and the fastest riser of the lot at +4.0%.
- Wokingham, over the Berkshire line at Eversley: £496,537, dearer than Hart, but down 0.9% on the year.
- Waverley, further into Surrey: £553,429, and down 2.6%.
What changed in the figures we published last month
The UKHPI is revised every month as more completed sales are registered, and Hart’s past year has moved more than most.
- June. We reported £479,978 on 21 August. It is now £480,477, revised up by £499.
- May. Published at £486,882, then revised to £483,133, and now £484,429.
- January. We called it a peak of £490,134. It is now £486,221, revised down by £3,913.
That last one matters for anyone tracking the top of the market. On the current data, July is £5,170 below January, not the £10,156 gap we set out in August. The revisions do not change the direction of the year, but they do change the size of the fall, and we would rather print that than quietly update a table.
Sales volumes for June and July are not yet published. The last full month is May, with 86 recorded sales in the whole district.
What it means for you
- If you are selling, the useful number for a listing is the type figure, not the district average. A semi in Hart is a £481,069 home on these figures and a flat is a £239,550 one.
- If you are a first-time buyer, the Hart average for first-time buyer purchases is £358,898, up 2.5% over the year. That is £122,153 below the district’s overall average, because first-time buyers here are largely buying flats and terraces.
- Do not read a single month as a trend. July’s numbers will be revised, probably twice, and the last three months of Hart data have each moved after publication.
- For a town-level picture, the UKHPI has no separate series for Fleet, Hook, Odiham or Yateley. Our Fleet house prices page sets out what is and is not published at that level.
- Council tax is banded on 1991 values, not these, so a rising average does not move your band. Our Hart council tax bands page has the 2026-27 charges.
Sources
- UK House Price Index, Hart district, July 2026, HM Land Registry, for the average price, the annual and monthly changes, the figures by property type, the first-time buyer and former owner-occupier averages, and the revised figures for January to June 2026.
- UK House Price Index reports on GOV.UK, for the 16 September 2026 release date.
- UK HPI full data file, July 2026, for the eleven Hampshire districts, the neighbouring districts, the England and county figures, and for Hart’s rank among the 295 English local authority districts.
- Our own Hart house prices, June 2026 report of 21 August 2026, for the figures since revised.
Have your say